5.5.4 Data Visualization
Foxglove Visualization
Use Foxglove Studio to visualize robot topic data in real time.
The robot runs foxglove_bridge to publish topic data via WebSocket; the host PC runs the Foxglove client to subscribe and visualize. Both must be on the same network.
Install Foxglove
Install Foxglove Desktop or use the Web version on the host PC; either can be used with any account:
Desktop: https://foxglove.dev/download
Note
When using the web version to connect to the robot (plain ws:// connection), the browser may block the connection due to security policies; in that case, select Enable insecure scripts in the top-right corner of the page.
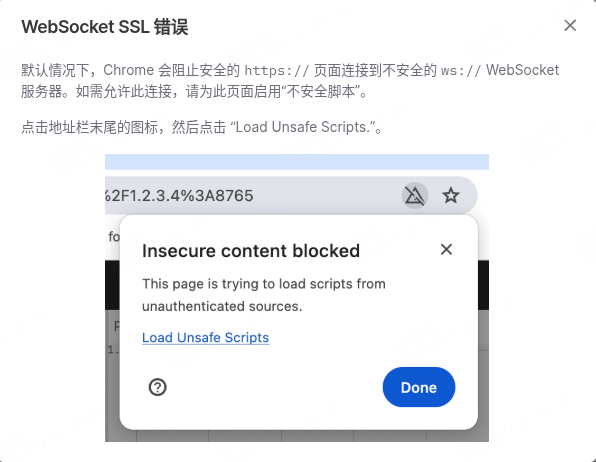
Launch foxglove_bridge
Launch foxglove_bridge on the development computing unit (PC2, 10.0.1.41; pre-installed in the environment):
# Source environment variables
source /opt/ros/humble/setup.bash
source ~/aimdk/install/setup.bash

# Launch foxglove_bridge (default configuration)
ros2 launch foxglove_bridge foxglove_bridge_launch.xml
Connect to the Robot
In the Foxglove Desktop / Web version on the host PC, open the console and select Open connection.
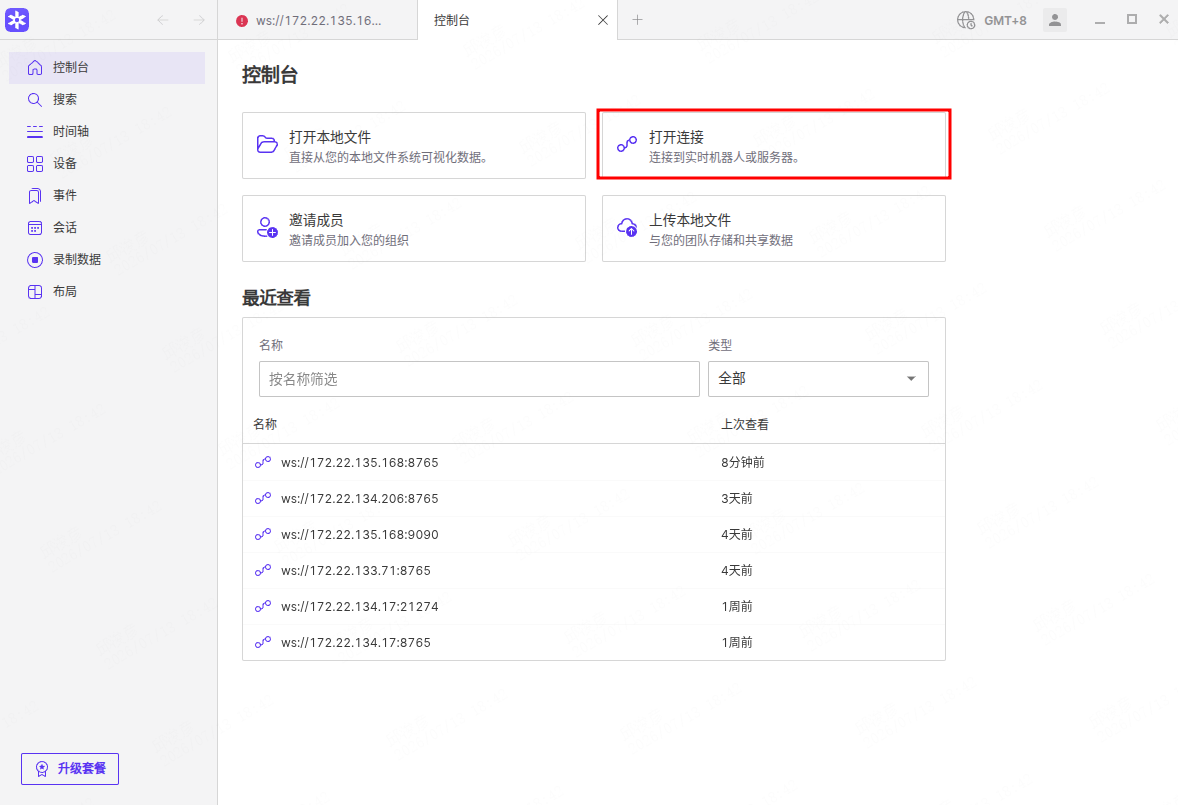
Open Foxglove, click Open connection and select Foxglove WebSocket. Replace localhost in the default address ws://localhost:8765 with the robot’s IP, then click Open to establish the connection.
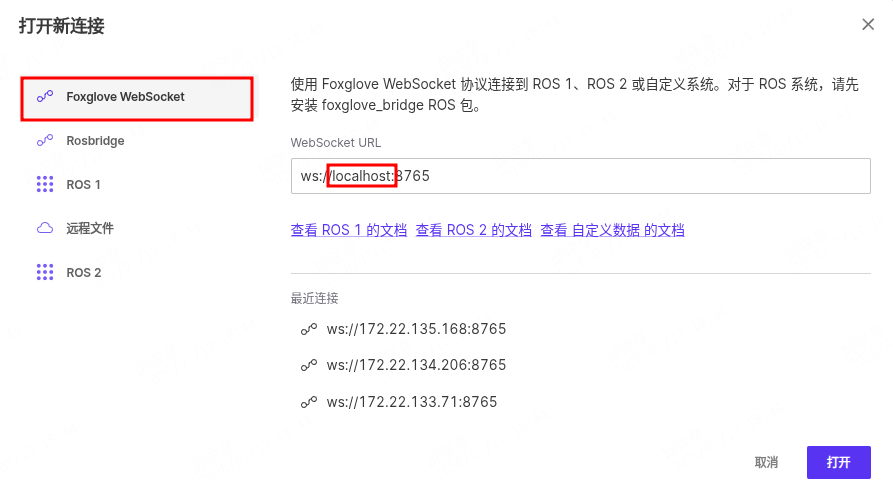
Add panel
After connecting, select Add panel in the top-right corner and choose the appropriate panel for the target topic – e.g., the 3D panel for LiDAR point cloud, or the transform tree for TF relationships.
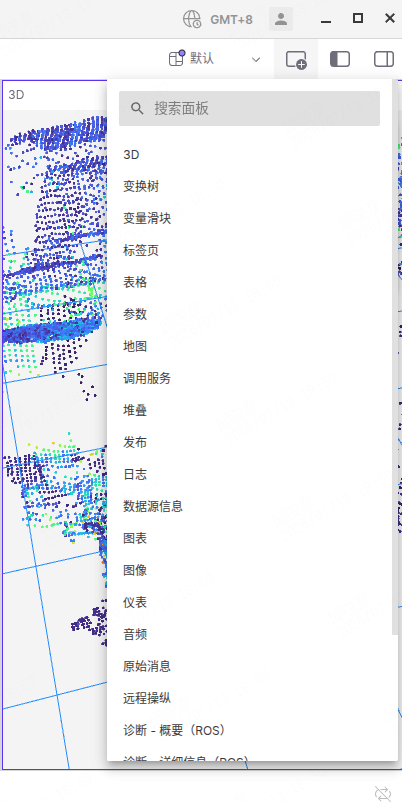
Topic Settings
Click a panel to select its visualization settings on the left, such as the topic and reference frame.
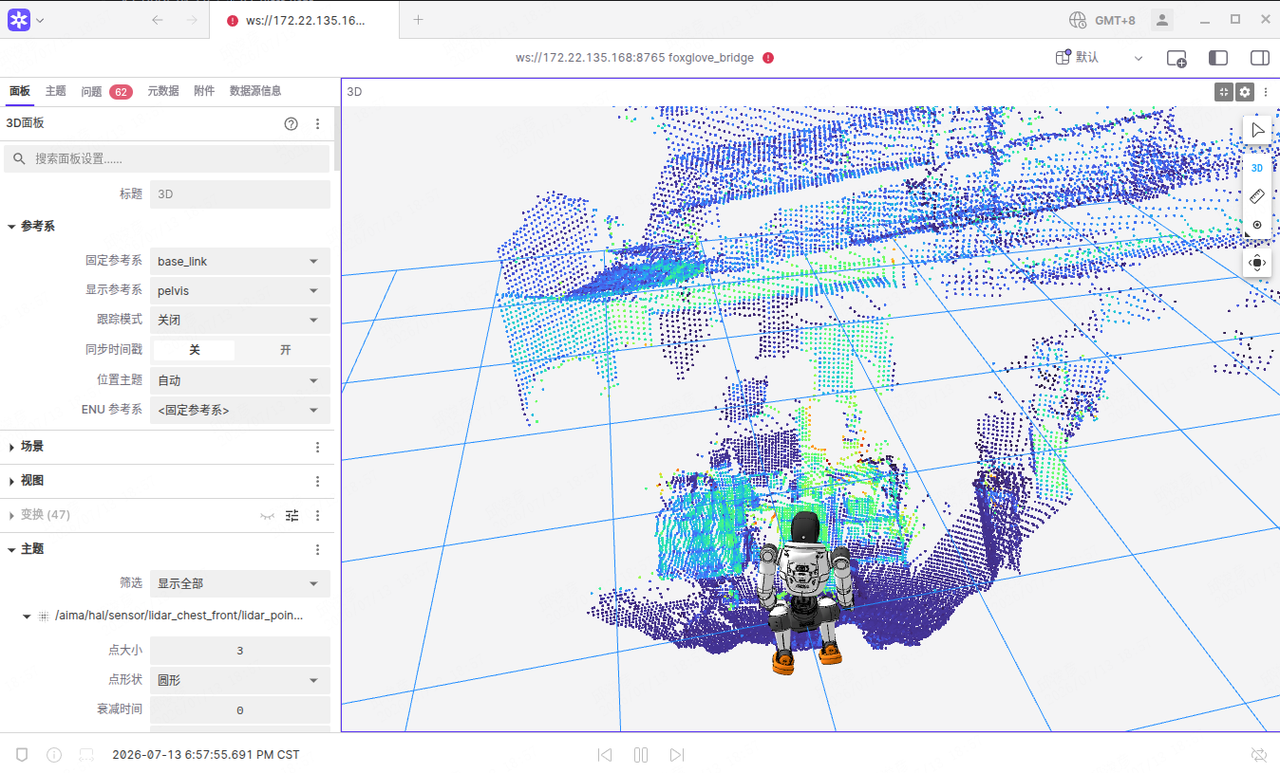
Import Layout
Instead of adding panels manually, you can import a preset layout directly (URDF display is limited to the Desktop version). Click the Layout icon in the top-right corner of Foxglove:
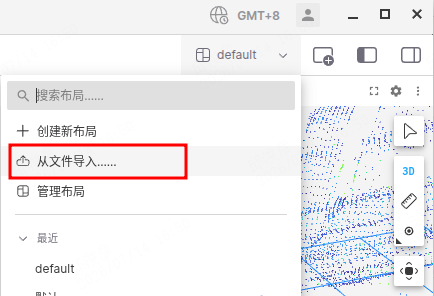
Import the configuration file below (replace $URDF_DIR in the file with the actual local URDF path before use): foxglove_layout.json
foxglove_layout.json (click to expand)
{
  "configById": {
    "Image!3uaqfl": {
      "cameraState": {
        "distance": 20,
        "perspective": true,
        "phi": 60,
        "target": [
          0,
          0,
          0
        ],
        "targetOffset": [
          0,
          0,
          0
        ],
        "targetOrientation": [
          0,
          0,
          0,
          1
        ],
        "thetaOffset": 60,
        "fovy": 45,
        "near": 0.5,
        "far": 5000
      },
      "followMode": "follow-pose",
      "scene": {},
      "transforms": {},
      "topics": {},
      "layers": {},
      "publish": {
        "type": "point",
        "poseTopic": "/move_base_simple/goal",
        "pointTopic": "/clicked_point",
        "poseEstimateTopic": "/initialpose",
        "poseEstimateXDeviation": 0.5,
        "poseEstimateYDeviation": 0.5,
        "poseEstimateThetaDeviation": 0.26179939
      },
      "synchronize": false,
      "imageMode": {
        "imageTopic": "/aima/hal/sensor/rgb_head_front_center/rgb_image/compressed",
        "calibrationTopic": "/aima/hal/sensor/rgb_head_front_center/camera_info"
      }
    },
    "TransformTree!1x6xlz3": {},
    "3D!4h2shil": {
      "cameraState": {
        "distance": 7.169718448166827,
        "perspective": true,
        "phi": 51.81818181819366,
        "target": [
          0,
          0,
          0
        ],
        "targetOffset": [
          1.925555282550379,
          -0.29000302203140244,
          -3.7627255213825705e-17
        ],
        "targetOrientation": [
          0,
          0,
          0,
          1
        ],
        "thetaOffset": 111.27272727272965,
        "fovy": 45,
        "near": 0.5,
        "far": 5000
      },
      "followMode": "follow-pose",
      "scene": {
        "transforms": {
          "visible": false
        },
        "ignoreColladaUpAxis": true,
        "meshUpAxis": "z_up"
      },
      "transforms": {},
      "topics": {
        "/aima/hal/sensor/lidar_chest_front/lidar_pointcloud": {
          "visible": true,
          "colorField": "intensity",
          "colorMode": "colormap",
          "colorMap": "turbo"
        },
        "/perception/debug/obstacle_cluster": {
          "visible": false
        },
        "/aima/hal/sensor/rgb_head_rear/camera_info": {
          "visible": false
        },
        "/aima/hal/sensor/rgb_head_front_center/rgb_image/compressed": {
          "visible": false,
          "cameraInfoTopic": "/aima/hal/sensor/rgb_head_front_center/camera_info"
        }
      },
      "layers": {
        "grid": {
          "visible": true,
          "drawBehind": false,
          "instanceId": "d3834cc3-4c3e-40a9-8929-a318e6037634",
          "layerId": "foxglove.Grid",
          "size": 10,
          "divisions": 10,
          "lineWidth": 1,
          "color": "#248eff",
          "position": [
            0,
            0,
            0
          ],
          "rotation": [
            0,
            0,
            0
          ]
        },
        "44530a1b-44f8-4bf8-beb2-0a9e2df95e96": {
          "controlMode": "transforms",
          "jointStatesTopic": "",
          "displayMode": "auto",
          "fallbackColor": "#ffffff",
          "showAxis": false,
          "axisScale": 1,
          "showOutlines": true,
          "opacity": 1,
          "visible": true,
          "instanceId": "44530a1b-44f8-4bf8-beb2-0a9e2df95e96",
          "layerId": "foxglove.Urdf",
          "label": "URDF",
          "sourceType": "filePath",
          "url": "",
          "filePath": "$URDF_DIR/x2_ultra.urdf",
          "parameter": "",
          "topic": "",
          "framePrefix": "",
          "order": 1
        }
      },
      "publish": {
        "type": "point",
        "poseTopic": "/move_base_simple/goal",
        "pointTopic": "/clicked_point",
        "poseEstimateTopic": "/initialpose",
        "poseEstimateXDeviation": 0.5,
        "poseEstimateYDeviation": 0.5,
        "poseEstimateThetaDeviation": 0.26179939
      },
      "synchronize": false,
      "imageMode": {},
      "followTf": "base_link"
    }
  },
  "globalVariables": {
    "globalVariable": 3
  },
  "userNodes": {},
  "playbackConfig": {
    "speed": 1
  },
  "layout": {
    "direction": "row",
    "first": {
      "first": "Image!3uaqfl",
      "second": "TransformTree!1x6xlz3",
      "direction": "column"
    },
    "second": "3D!4h2shil"
  }
}
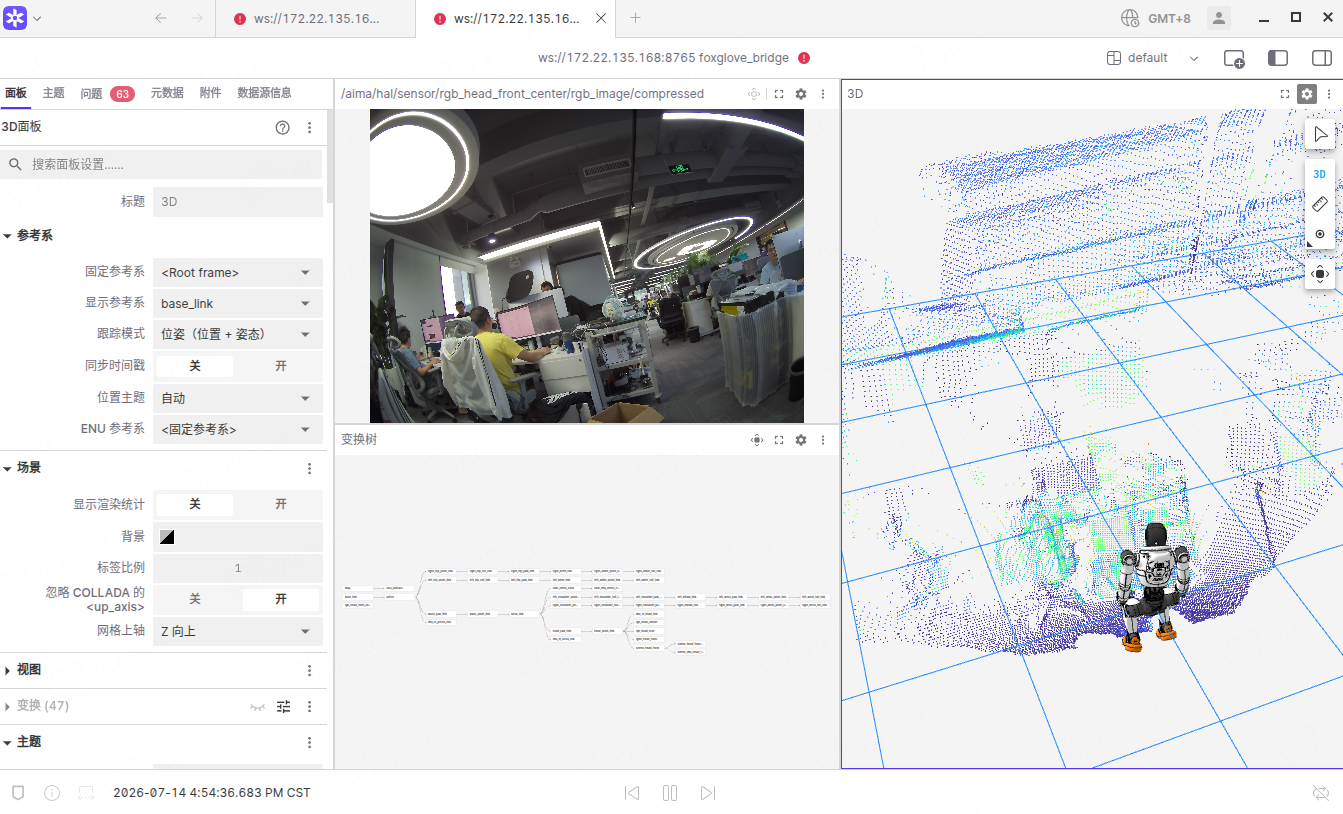
This layout simultaneously displays LiDAR point cloud, URDF, interaction camera, and TF live data:
For more configuration options, see the Foxglove documentation.
Mapping and Relocalization
Perception topics such as elevation map and dynamic obstacles depend on mapping and relocalization being ready. Prerequisites:
The robot must be in stable standing mode.
The following apps must be running (they usually start automatically with the system; verify with
ros2 node list):slam— Mapping and relocalizationmap_manager— Map managementperception— Perceptionpnc— Planning and controlauto_integrated— Navigation integration
Warning
Do not enter the autonomous development mode in developer mode, otherwise the above apps may not start automatically, resulting in no data on perception topics.
If the prerequisites are not met, the relevant topics will publish no data. You can verify as follows:
# Check if nodes are running
ros2 node list | grep -E "slam|perception|pnc"

# Check if topics have data (should show continuous output)
ros2 topic hz /perception/grid_map
Perception Visualization Topics
Topic Name |
Message Type |
Description |
QoS |
Frequency |
|---|---|---|---|---|
|
Left fisheye image instance segmentation visualization (for debugging, to understand what the robot recognizes) |
|
10Hz |
|
|
Semantic point cloud (obstacle avoidance input; distinguishes traversable / obstacle / pedestrian) |
|
10Hz |
|
|
Elevation map (terrain traversability; identifies steps / pits / slopes) |
|
10Hz |
|
|
Dynamic obstacles (dynamic obstacle avoidance; tracks moving people / objects) |
|
10Hz |
All topics QoS: history=keep_last, depth=10, reliability=reliable, durability=volatile
Coordinate System
Robot component frames follow the ROS standard FLU convention (X forward, Y left, Z up). See Coordinate System. This chapter involves two key frames:
Frame |
Meaning |
Characteristics |
|---|---|---|
|
Global world frame, established during SLAM mapping |
Fixed; Z axis points up, x/y in the horizontal plane; used by elevation map and dynamic obstacles |
|
Robot body frame (gravity-aligned) |
Translates and rotates with the robot; X axis points forward, Y axis points left, Z axis points up; used by semantic point cloud |
Relationship: map is the fixed world reference frame; gravity_aligned_base_link moves with the robot. The robot’s position and orientation in map can be queried via the TF transform map → gravity_aligned_base_link, for example:
# Query the robot's pose in the global map (translation=position, rotation=orientation)
ros2 run tf2_ros tf2_echo map gravity_aligned_base_link
Impact on visualization data:
Coordinates of topics such as elevation map and dynamic obstacles are relative to
map; their directions are fixed in the world and do not change with the robot’s heading.Coordinates of the semantic point cloud are relative to
gravity_aligned_base_link; they change with the robot’s heading (the X axis always points forward).To convert coordinates between the two frames, use TF (
tf2_ros/tf2_geometry_msgs).
Image Instance Segmentation Visualization
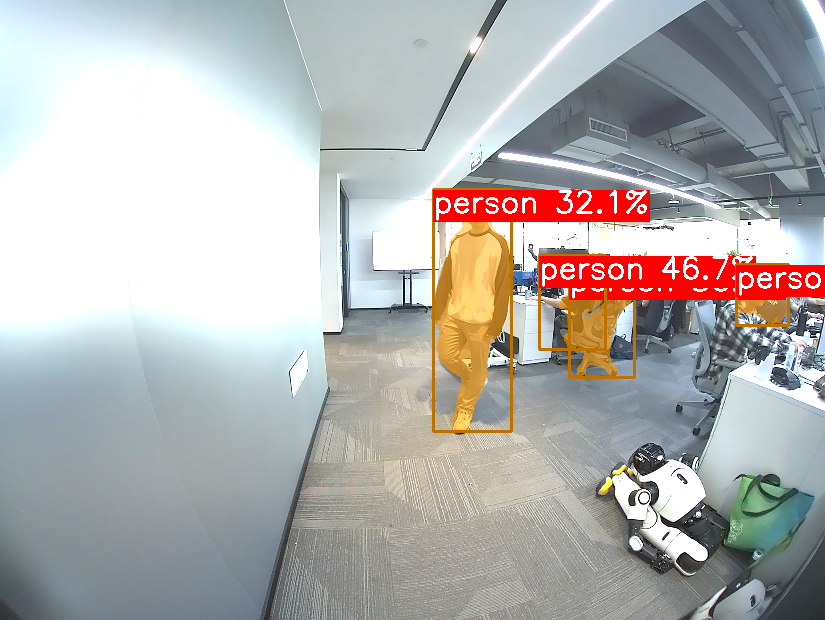
Visualizes instance segmentation results on the left fisheye image, including class names, confidence scores, bounding boxes, and segmentation masks.
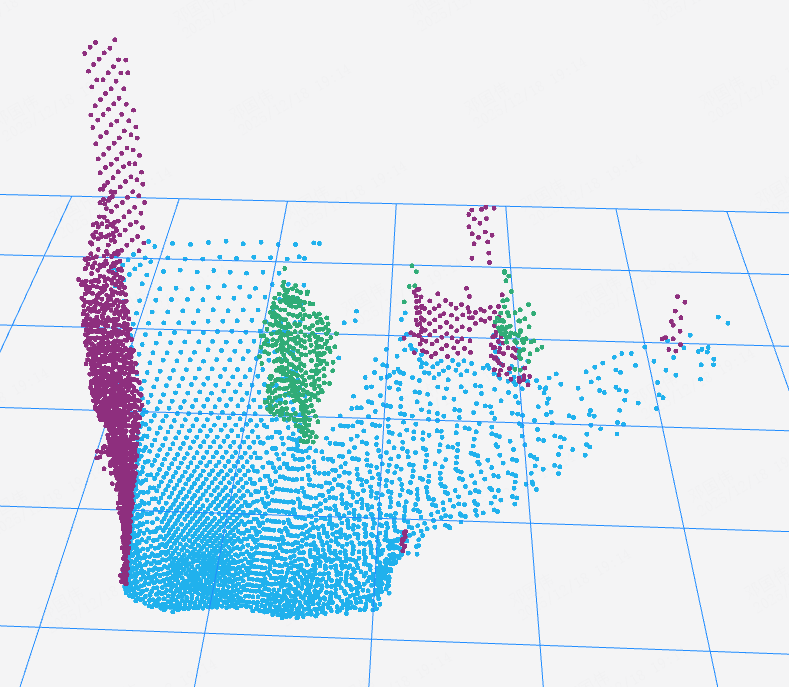
Semantic Point Cloud
Point cloud within the current sensor FOV. frame_id is gravity_aligned_base_link (robot body frame, X axis points forward, see Coordinate System above). Colors are used to distinguish semantic categories (BGR values):
Semantic Category |
BGR |
Color |
|---|---|---|
Traversable Area |
|
Blue |
Static Obstacle |
|
Purple |
Pedestrian |
|
Green |
Colors are stored in the rgb field of PointCloud2 (a float32 bit-cast to uint32 in 0x00RRGGBB format). For the unpacking method, see ROS2 sensor_msgs_py/point_cloud2.py.
Elevation Map
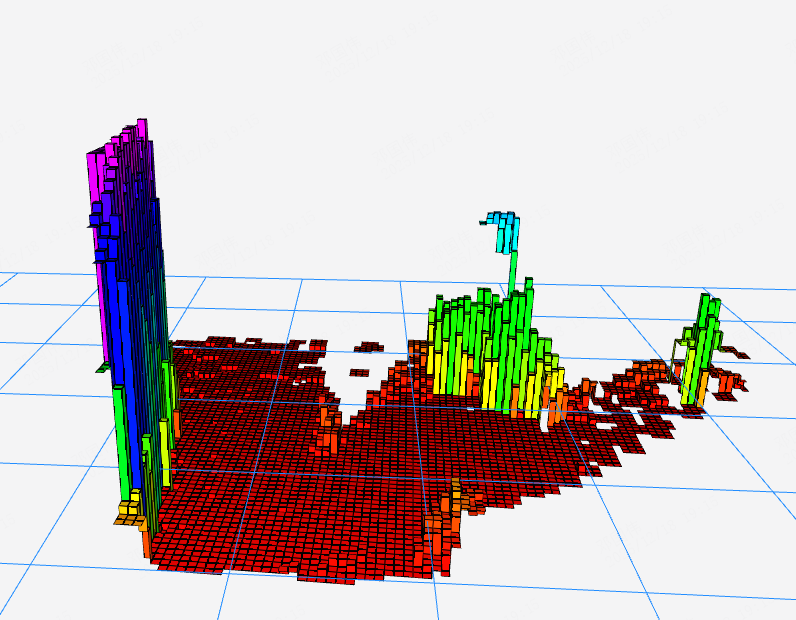
Elevation grid map generated from current sensor input, frame_id is map (frame origin and orientation are fixed; see Coordinate System above), resolution 0.05 m, size 8 m × 8 m (160 × 160 cells). The map is a sliding window that follows the robot: each frame centers the window on the robot’s position (info.pose.position is the robot’s position in map), so the robot is always at the center of the map. The actual coverage is approximately ±4 m around the robot; cell data outside the window is discarded. Note that what translates is the map window (visible area), not the coordinate frame itself — cell coordinates are always absolute map coordinates and do not change with robot movement. Contains three layers:
Layer |
Message Type |
Content |
|---|---|---|
|
|
Cell height value (z in |
|
|
Elevation variance, reflecting the uncertainty of the cell’s height estimate; unobserved cells are |
|
|
Semantic type, takes |
The semantic value of each cell is accumulated from multiple observations: new observations update the cell’s semantic confidence, and cells unobserved for a long time gradually lose confidence. Message parsing uses GridMapRosConverter::fromMessage; see the grid_map_ros official documentation.
Dynamic Obstacles
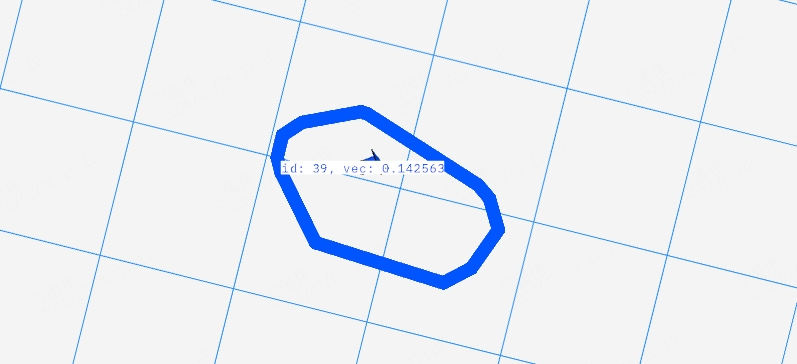
Each obstacle corresponds to 4 markers, distinguished by namespace (ns) and type (type):
Marker namespace ( |
Type ( |
Content |
|---|---|---|
|
|
Obstacle center position, stored in |
|
|
Obstacle velocity: direction stored in |
|
|
Obstacle ID and speed magnitude, stored in |
|
|
2D bounding polygon vertices, stored in |
The 4 markers of each obstacle share the same color, assigned automatically by obstacle ID. This differs from the semantic point cloud, which is colored by category.
The markers array of each MarkerArray message is constructed in the following order:
First, 4 markers with
action = DELETEALL(3) are appended, one for each of the above namespaces, to clear the previous frameThen, for each obstacle, 4 markers with
action = ADD(0) are appended in order (cylinder→arrow→text→polygon) to redraw the current frame
Thus each message contains a complete frame; subscribers can simply replace with the latest frame without cross-frame accumulation. The topic refreshes at 10 Hz. All markers’ header.frame_id is map (global world frame; see Coordinate System above), and header.stamp is the current frame timestamp. Unlike the elevation map, dynamic obstacle coordinates are absolute map coordinates and do not translate or clip with robot movement — any obstacle observed by the sensors is placed in map; the robot’s position is not encoded in the message (query via TF).
In the image, the thin cylinders represent obstacle center points (cylinder markers), and the outer polygons represent obstacle outlines (polygon markers).
RSView Visualization
RSView is a LiDAR data visualization tool provided by RoboSense. It displays E1R point cloud data in real time and also supports offline playback from .pcap files.
Software Features
Real-time data display over Ethernet
Save live data recordings as PCAP files
Playback from recorded PCAP files (
.pcapngformat not supported)Multiple visualization modes: distance, time, horizontal angle, reflectivity, laser beam ID, etc.
Display point data in table format
Export point cloud data as CSV files
Distance measurement tool
Display multiple consecutive frames of playback data simultaneously
Crop display
Install RSView
RSView runs on Windows 64-bit and Ubuntu 18.04 and above.
Download the latest version from the RoboSense website: https://www.robosense.cn/resources-160
No installation required; extract the archive and run the executable. Do not use paths containing Chinese characters.
Online Mode
Attention
On the integrated X2 robot, RSView online mode is unavailable – use Foxglove / RViz instead to view the point cloud in real time. There are two reasons:
Unicast: the E1R point cloud on the robot is unicast, sent only to the robot itself (e.g.,
10.11.1.1); other computers on the same subnet cannot receive this data.Ports occupied: the MSOP / DIFOP ports (
6699/7788) are exclusively bound by the robot’s HAL driver, so RSView cannot bind to them.
The correct way to view the point cloud in real time: the HAL driver converts the LiDAR UDP data into ROS topics in real time. Simply subscribe in the Foxglove 3D panel (or RViz) – same source data, same real-time performance, zero changes, no disruption to the robot:
/aima/hal/sensor/lidar_chest_front/lidar_pointcloud # sensor_msgs/PointCloud2
See the Add Panel / Import Layout sections in “Foxglove Visualization” above for usage. For offline analysis of recorded data only, see “Offline Playback (PCAP files)” below.
Offline Playback
Capture packets on the LiDAR network interface using
dumpcap:
dumpcap -i sensor0 -f "udp port 6699 or udp port 7788" \
    -w ~/lidar_capture.pcap
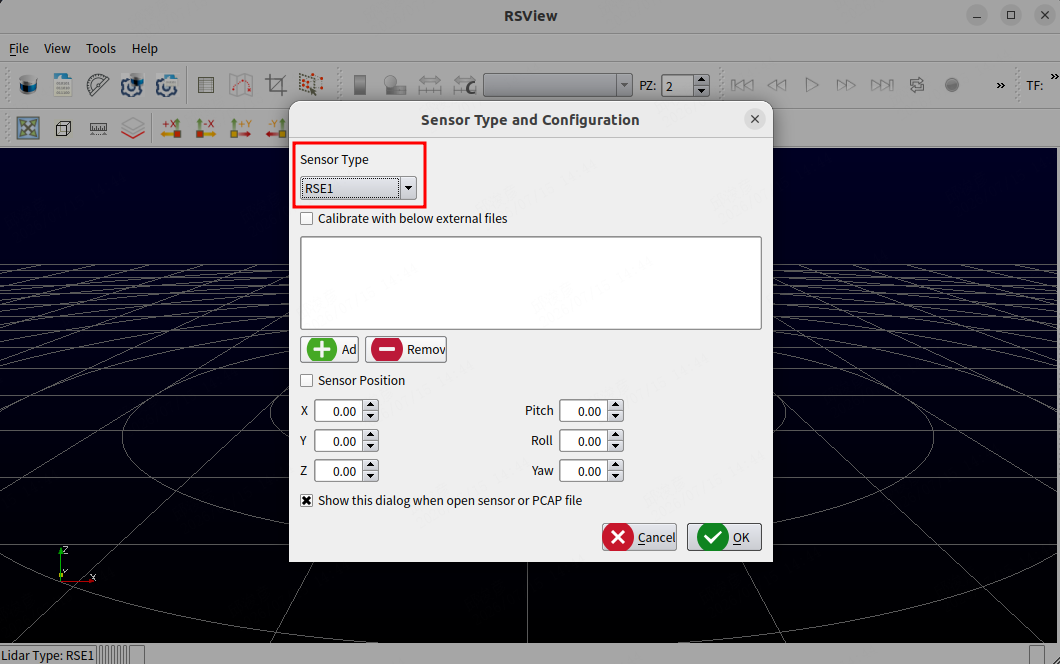
In RSView, select File → Open PCAP File from the top-left menu, choose the recorded
.pcapfile, and select the corresponding sensor type for playback.
RViz Visualization
RViz subscribes to robot topics directly via DDS, enabling real-time observation of the robot model, motion behavior, TF, LiDAR point cloud, maps, and more.
Attention
RViz relies on direct DDS network connectivity and currently only supports wired connections (no VPN / wireless). See Network Connection for network port configuration.
After completing the wired connection per Network Connection and setting ROS_DOMAIN_ID to match the robot, launch RViz2:
source /opt/ros/humble/setup.bash
rviz2
TF, LiDAR point cloud, maps, motion behavior, etc. are all subscribed directly via DDS with no additional publishing required. To view the URDF (robot model), open a separate terminal and publish robot_description:
source install/local_setup.bash
ros2 run robot_state_publisher robot_state_publisher \
    --ros-args -p robot_description:="$(
      sed "s#filename=\"\\./meshes/#filename=\"file://$URDF_DIR/meshes/#g" \
      "$URDF_DIR/x2_ultra.urdf"
    )"  # Replace $URDF_DIR with the actual URDF file path
System Status, Logs, and Communication Visualization
A robot debugging TUI tool. SSH-friendly, no GUI required. A unified menu-driven Textual app that consolidates the most commonly viewed debugging information on-site, without depending on RViz / Foxglove – works in a plain terminal.
Key Features
System Status Dashboard (dash)
Five real-time panels showing the status of the five major subsystems:
MC Action: current motion behavior (e.g.,
STAND_DEFAULT/LOCOMOTION_DEFAULT) and running / transition statusSystem: SystemState business status (e.g.,
IN_READY/IN_MOVE)Faults / HDS: active diagnostic codes, alert codes, post-proc signal count, and the most recent code
PMU / Battery: PMU temperature, Orin voltage / current, battery capacity, error bits
Orin: Jetson Orin CPU / GPU / MEM / temperature, published by a separate orin-monitor process
Log Aggregation (logs)
Consolidates multiple log sources into a single TUI page with real-time viewing, historical queries, and filtering:
ROS 2 node logs:
~/.ros/log/<latest_session>/(default source; skip with--no-ros)Other log files: add with
--add-path FILEOptional subscription:
/rosout(--rosout, real-time mode only)Automatically parses multiple timestamp formats and normalizes time zones
Supports queries such as
--since 10m,"yesterday 18:00", and absolute timestampsSupports a filter DSL, e.g.,
level>=WARN node~=slam connect
Communication Visualization (comm)
Displays topics / services in the current ROS graph; hidden topics are filtered by default, consistent with
ros2 topic list. Supports on-demand frequency measurement for selected topics with zero subscription overhead at startup and automatic QoS matching to the publisher.Faults / HDS (faults)
Dedicated screen for the health diagnostics system:
Live: real-time display of Diag / Alert / PostProc data
History: query historical faults via
GetHdsEventHistory, with filtering by time window, state, and diagnostic code, plus pagination
Orin Monitor Publisher (orin-monitor)
An independent ROS 2 node that collects Jetson Orin resource metrics (CPU / GPU / MEM / temperature, etc.) and publishes them as
diagnostic_msgs/DiagnosticArrayto/orin/stats. Collection is based on psutil + tegrastats; data can be consumed by dash, bag recording, or other nodes.
Unified entry: ros2 run robotop robotop without arguments opens the menu; use arrow keys to select a screen, Enter to enter, q in a sub-screen returns to the menu, q in the menu exits, Ctrl+C force-quits from anywhere. Direct subcommands are also available: robotop dash / robotop logs --since 1h, etc.
Installation
The workspace dependencies already include aimdk_msgs, rclpy, and diagnostic_msgs. Install the runtime Python packages to the user directory:
pip3 install --user typer textual dateparser
Build:
cd ~/aimdk
colcon build --packages-select robotop
source ~/aimdk/install/setup.bash
Note: the
dashOrin card requires a separateorin_monitor_noderunning in the background to publish/orin/stats; otherwise it will show stale:ros2 run robotop orin_monitor_node
Command Overview
Command |
Function |
|---|---|
|
Top-level menu, unified entry point |
|
System status panel (MC / System / Faults / PMU / Orin) |
|
Aggregate ROS / app logs, real-time or historical |
|
Topic / service listing + on-demand frequency measurement |
|
HDS diagnostics / alerts live table; |
|
Publish |
ros2 run robotop robotop                          # Enter menu (recommended)
ros2 run robotop robotop <subcmd> [options]       # Go directly to a screen
ros2 run robotop orin_monitor_node                # Standalone node, suitable for systemd
dash – System Status
ros2 run robotop robotop dash
Five cards:
Card |
Data Source |
Description |
|---|---|---|
MC Action |
|
Current MC mode + status (RUNNING / TRANSITION / IDLE) |
System |
|
Business status name (IN_READY / IN_MOVE, etc.) |
Faults / HDS |
|
Active diag / alert count + most recent code |
PMU / Battery |
|
PMU temperature, voltage / current, battery capacity, error bits |
Orin |
|
Requires orin_monitor_node to be running first |
Keys: q returns to menu, r refreshes immediately, Ctrl+C force-quits. A card showing [stale] indicates the corresponding data source is not connected.
logs – Log Aggregation
Real-time (default)
ros2 run robotop robotop logs --follow
ros2 run robotop robotop logs -f --rosout                          # Add /rosout subscription
ros2 run robotop robotop logs -f --add-path ~/.aima/log/aima.log   # Add AIMA logs
ros2 run robotop robotop logs -f --no-ros                          # Skip ROS session log source
Default source: the latest .log file in the most recent ROS session (~/.ros/log/<latest_session>/<latest>.log). Other logs such as AIMA and AIMRT must be explicitly added with --add-path.
Historical Queries
ros2 run robotop robotop logs --since 1h
ros2 run robotop robotop logs --since 7d --level WARN
ros2 run robotop robotop logs --since "2026-06-04 14:00" --until "2026-06-04 16:00"
ros2 run robotop robotop logs --since 30m --grep "fall"
--since / --until support: relative (30s / 10m / 1h / 2d), now, natural language ("yesterday 18:00"), and absolute timestamps ("2026-06-04 14:00").
TUI Key Bindings
Key |
Action |
|---|---|
|
Enter the top filter input field |
|
Exit the filter field and return to the log area |
|
Apply the current filter |
|
Clear screen |
|
Quit |
Filter DSL: top input field, space-separated, all terms must match.
Expression |
Meaning |
|---|---|
|
Message contains both “error” and “connect” (case-insensitive) |
|
Level exactly equals ERROR |
|
WARN and above (DEBUG < INFO < WARN < ERROR < FATAL) |
|
Source contains “slam” |
|
Same as above (alias for |
faults – HDS Faults
Live (default)
ros2 run robotop robotop faults
Three tabs correspond to: Diag (/aima/hds/diag_code_list), Alert (/aima/hds/alert_code_list), PostProc (/aima/hds/post_proc/signal).
History
ros2 run robotop robotop faults --history --since 1h
ros2 run robotop robotop faults --history --since 1d --state active
ros2 run robotop robotop faults --history --diag-code 0x6300000001
ros2 run robotop robotop faults --history --alert-code battery_low --asc
Parameter |
Meaning |
|---|---|
|
Time window, same parsing rules as logs |
|
State filter |
|
Filter by diagnostic code (repeatable) |
|
Filter by alert string (repeatable) |
|
Maximum entries returned (default 200) |
|
Chronological order (default: newest first) |
comm – Communication Visualization
ros2 run robotop robotop comm                    # Same as ros2 topic list by default
ros2 run robotop robotop comm --include-hidden   # Show all, including _* hidden paths
Two tabs: Topics (columns M / topic / type / pub / sub / hz / count) and Services (columns service / type).
Key |
Action |
|---|---|
|
Toggle frequency measurement: start subscribing + counting / stop and destroy subscription |
|
Stop frequency measurement for all topics at once |
|
Enter the top filter bar (substring match on name or type) |
|
Exit filter and return to the table |
|
Re-enumerate immediately |
|
Quit |
orin-monitor – Orin Resource Publisher
ros2 run robotop orin_monitor_node               # 1 Hz, default
ros2 run robotop orin_monitor_node --rate 2      # 2 Hz
Collection is based on psutil + tegrastats. Published to /orin/stats as diagnostic_msgs/msg/DiagnosticArray. Keys include: cpu_pct_avg, cpu_cores, cpu_pct_core_0..N, gpu_pct, mem_used_mb, mem_total_mb, mem_pct, temp_cpu, temp_gpu, temp_thermal, power_total_mw.
Persistent operation (tmux):
tmux new -d -s orin 'source /opt/ros/humble/setup.bash && source ~/aimdk/install/setup.bash && ros2 run robotop orin_monitor_node'
# View output: tmux attach -t orin  (Ctrl-b d to detach without killing the process)
# Stop: tmux kill-session -t orin